FORT MYERS
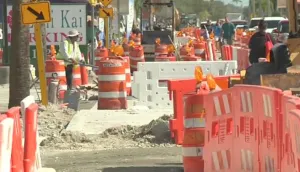
Fort Myers police crackdown on traffic violations on Colonial Blvd.
The roads on Colonial Boulevard are notorious for traffic congestion and crashes, but there might be hope on the horizon.

A very common product that meteorologists use to show active tropical systems is the tropical satellite graphic. This graphic is a map with a satellite depiction of the system shown using a rainbow color table.
The colors closer to dark red on the spectrum indicate clouds that are colder and higher in the atmosphere. These areas are indicative of intense convection, or moist air rising high quickly in the atmosphere.
The colors get cooler as the clouds and air parcels become lower and warmer in the atmosphere. The grey colors on the satellite are the lowest clouds.
Meteorologists use this graphic to illustrate the status of systems.
There are many things that can be extracted from looking at a system in real time on satellite. The first of which is how rapidly the storm is developing.
If the satellite loop shows deep red colors popping up continually near the center of the storm, this means that there is plenty of energy in the center of the system, which allows it to develop further. Satellite images also show circulation of storms. Generally, the more organized storms are, the stronger their circulation will appear on satellite.
Additionally, meteorologists use the tropical satellite to observe ongoing eyewall replacement cycles in tropical storms and hurricanes.

Eyewall replacement cycles happen when a new eye of a hurricane forms around the previous eye. In the replacement of the old eye with the new eye, the new eye appears to “eat” the old eye and decrease in its diameter.
While this is ongoing, the hurricane will decrease in intensity. This is where the importance of the satellite image comes in: although data may show weakening, looking at the tropical satellite imagery, meteorologists can decipher if an eyewall replacement cycle is ongoing.
Satellite imagery is also helpful because it is taken from space. Tropical systems can damage radars with their intense winds.
Satellites are a consistent source of data that are not impacted by the severe conditions within the systems.